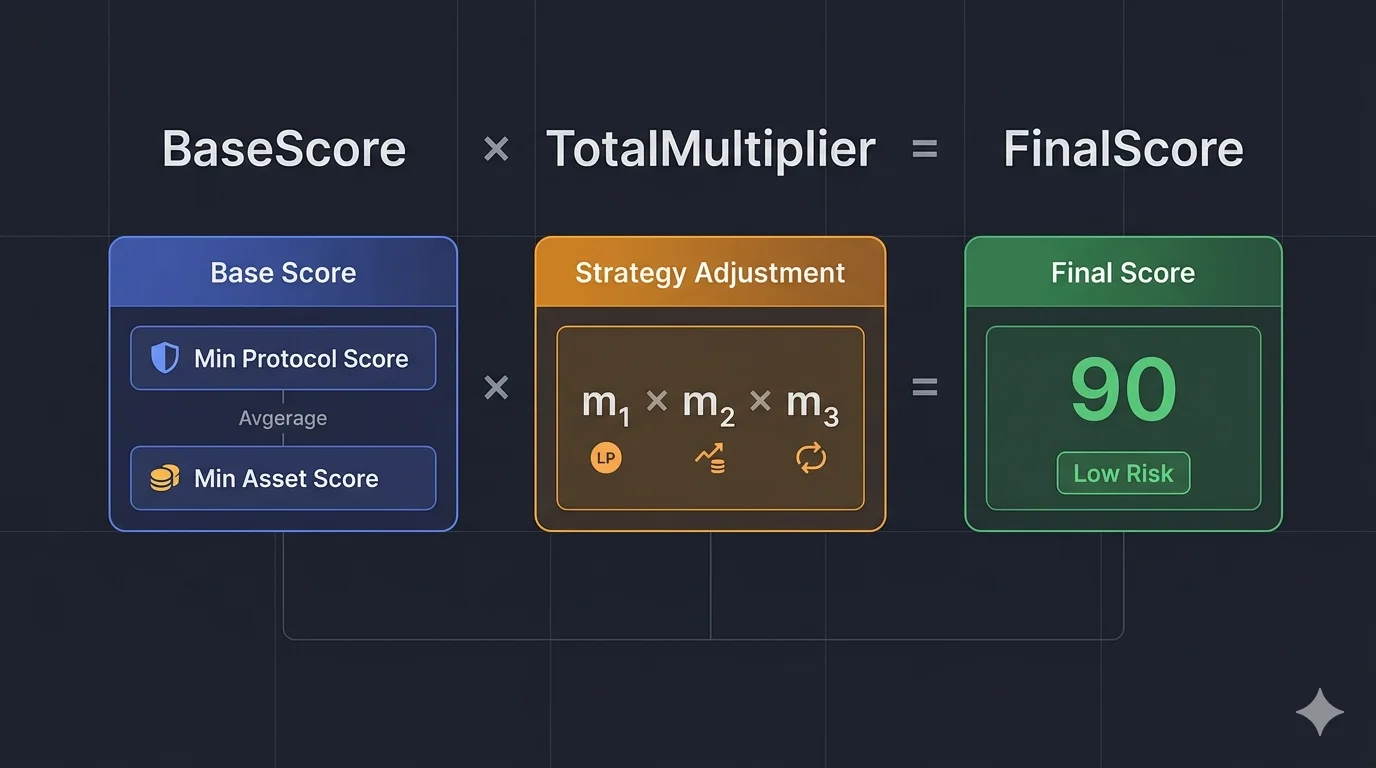
DeFi Sentinel's Strategy Safety Score is our own risk evaluation framework. Here's how it works: a bottleneck-based Base Score from the weakest protocol and weakest asset, multiplied by a strategy-specific adjustment factor that reflects execution risk.

TL;DR — The Strategy Safety Score is DeFi Sentinel's own evaluation framework. It combines two things: a Base Safety Score (determined by the weakest-link protocol and weakest-link asset in the strategy) and a Strategy Adjustment (a multiplier reflecting the inherent risk of the execution approach itself). Final Score = Base × Adjustment, mapped to Low / Middle / High Risk.
The Strategy Safety Score is not an industry standard or third-party metric. It's a framework we designed specifically for evaluating DeFi yield strategies in a consistent, comparable way.
Protocol ratings and asset ratings (covered in our protocol rating methodology) tell you how safe the individual building blocks are. But they don't tell you what happens when you combine those blocks into a strategy. A strategy safety score answers a different question: given these protocols, these assets, and this specific execution approach, how risky is this position overall?
This document explains the design decisions behind the score so you can understand not just what the number means, but why it's calculated the way it is.
Final Safety Score = round( BaseScore × TotalMultiplier )
Where:
BaseScore       = round( (MinProtocolScore + MinAssetScore) / 2 )
TotalMultiplier = Modifier₁ × Modifier₂ × … × Modifierₙ
The two components capture two fundamentally different types of risk: the risk embedded in the underlying building blocks (Step 1), and the risk introduced by how you use them (Step 2).
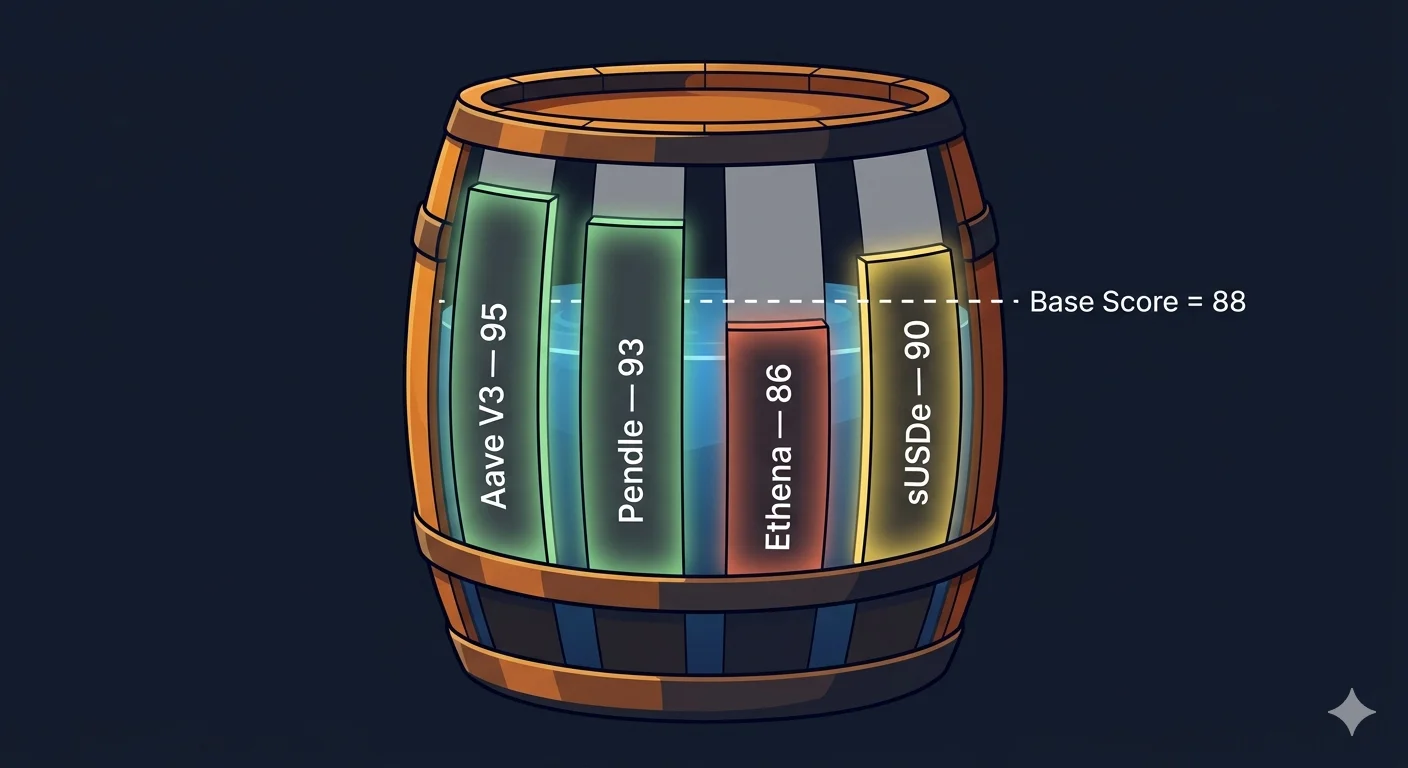
A real DeFi strategy rarely involves just one protocol. Consider an sUSDe looping position: you might interact with Aave for lending, Pendle for yield tokenisation, and hold a wrapped or synthetic token like sUSDe at the core. Each of these has its own safety score — the same scores we publish on our protocol and asset pages.
The question is: how do you aggregate them into one number?
The intuitive answer might be to multiply every protocol's score together (normalised), since each protocol is a point of failure. But this approach has two serious problems:
Problem 1 — Score collapse with complexity. If a strategy touches five protocols each scoring 85, and you multiply them, the result keeps shrinking: 85 × 85 × 85 × 85 × 85 ÷ 100⁴ ≈ 44. A strategy built entirely from best-in-class protocols would look worse than a single mediocre one. The number stops being useful as a reference.
Problem 2 — Real-world risk doesn't work multiplicatively. The biggest risk in any strategy usually comes from its weakest component, not the product of all of them. Take an Aave + Pendle sUSDe loop as an example. Aave and Pendle have been running without major incidents for years. The much more meaningful risk factor is ENA — the protocol behind USDe and sUSDe — which is newer, more complex, and less battle-tested. The chain breaks at its weakest link, not at the average of all links.
Instead of multiplying, we apply the barrel theory : a barrel can only hold water up to the level of its shortest stave. We identify the weakest link separately across two dimensions:
The Base Safety Score is the average of those two floors:
BaseScore = round( (LowestProtocolScore + LowestAssetScore) / 2 )
Averaging the two floors rather than taking a single global minimum reflects a practical judgement: a strategy where the weakest protocol scores 70 but all assets are strong is genuinely less risky than one where both the weakest protocol and weakest asset score 70. The two dimensions are partially independent.
The key point remains: adding more DeFi Lego bricks raises your exposure. Every additional protocol or asset you depend on is another potential point of failure. The more layers you stack, the more likely one of them becomes your shortest stave.
The base score captures how safe your building blocks are. But the same set of protocols and assets can be used in wildly different ways — and those ways carry their own risks that have nothing to do with how good Aave or Pendle is.
Buying PT on Pendle is a fixed-yield position. Once you buy the Principal Token, your main risk is that the underlying asset drops significantly below the PT's implied value before maturity — a scenario that would cause the PT to trade at a discount. Under normal market conditions this is a low-probability event.
Providing LP on Pendle is a very different story. You're exposed to impermanent loss driven by yield rate movements, not just price movements. If you enter an LP position when implied yields are low and exit when they're high (or vice versa), you can lose a substantial portion of the yield you thought you were earning. In a bad scenario, impermanent loss can exceed all accumulated fees — leaving you worse off than simply holding the underlying.
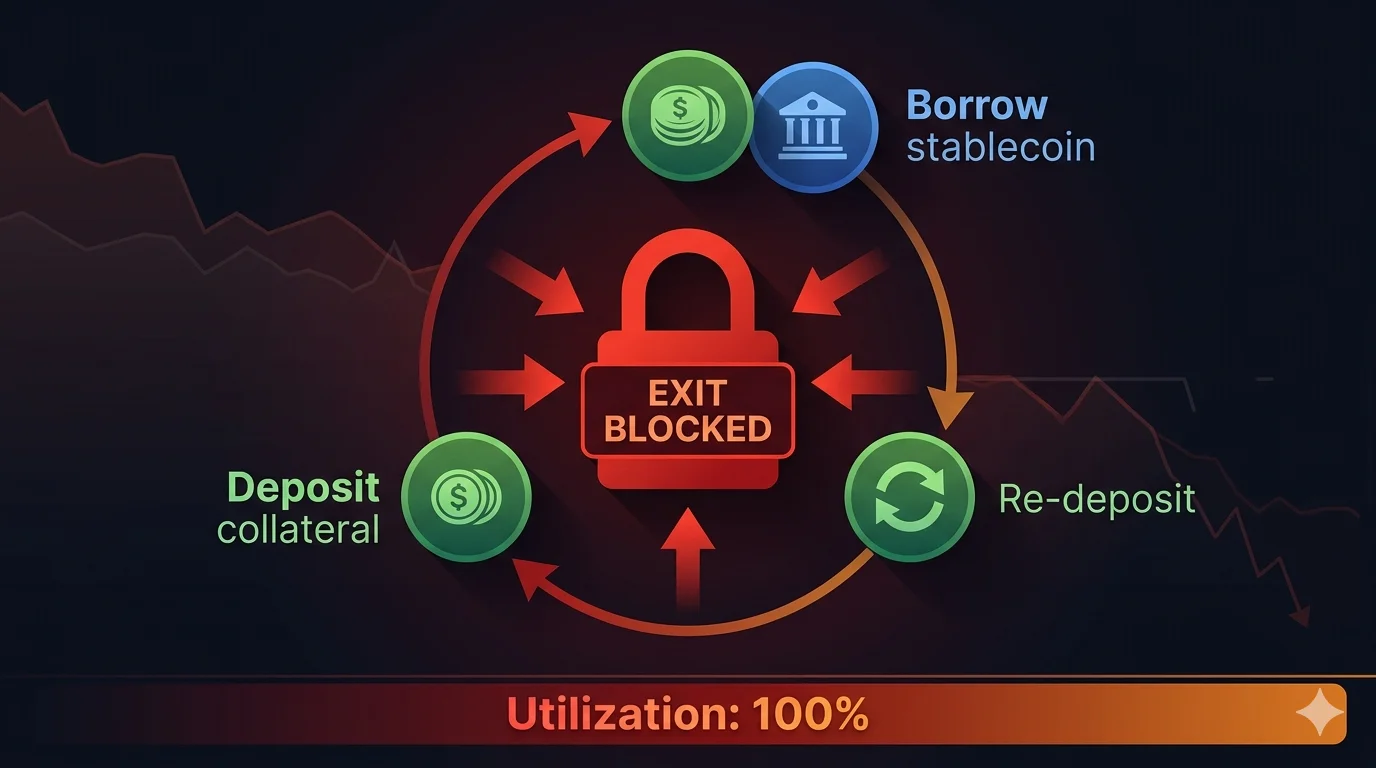
Looping (recursive lending) adds another level of danger entirely. If you loop at high leverage and any of the following occurs — the underlying asset depreciates, the lending rate spikes, or liquidity tightens — you may find yourself unable to deleverage.
In April 2026, Aave experienced a bad debt crisis where utilisation rates on major assets hit 100%. Borrowing rates on some markets shot past 10% APR, making the yield on virtually every looping strategy go deeply negative. Worse, because utilisation was at 100%, withdrawing the underlying asset to repay debt was impossible — bots were instantly absorbing any liquidity that freed up. Positions that had been earning 15% APY were suddenly losing 10%+ with no viable exit. Capital was trapped.
This is the risk class that the strategy adjustment multiplier is designed to flag.
Each strategy characteristic carries a multiplier between 0 and 1 (1.00 means no additional risk, lower means more risk). If a strategy has multiple characteristics, all multipliers compound:
TotalMultiplier = m₁ × m₂ × … × mₙ
Important: the adjustment only captures risk that is intrinsic to the strategy mechanics — leverage, liquidity structure, lock-in. The underlying protocol and asset risks are already reflected in the base score and are not double-counted here.
| Strategy Type | Multiplier | Why |
|---|---|---|
| Hold | 1.00× | No execution risk whatsoever |
| PT on Pendle | 0.99× | Very low risk; PT normally trades at or above par before maturity |
| LP on Pendle | 0.97× | IL exists, but exits at maturity carry essentially zero IL |
| LP on DEX (stablecoin pair) | 1.00× | Stablecoin pairs have negligible impermanent loss |
| Lending on platform | 1.00× | As a pure lender, the strategy itself adds no risk |
| Low leverage delta-neutral | 0.98× | Near-zero net directional exposure; risk only if one leg breaks |
| LP on DEX (non-stablecoin pair) | 0.95× | Meaningful IL if prices diverge significantly |
| High leverage delta-neutral | 0.95× | Delta-neutral reduces directional risk but an imbalance between legs or extreme volatility can still cause losses |
| Vault | 1.00× | Vault risk is entirely a function of its underlying protocol exposure, already captured in the base score |
| Looping (low leverage) | 0.90× | Higher structural risk than simple positions; liquidity crunch can trap capital |
| Looping (high leverage / max loop) | 0.80× | Extremely dangerous — a tight liquidation buffer combined with liquidity constraints can make deleveraging impossible |
The multipliers shown on each strategy page reflect the specific characteristics of that strategy. A strategy can carry multiple modifiers that compound together.
Final scores map to three risk tiers:
| Risk Class | Score Range | What it means |
|---|---|---|
| Low Risk | > 85 | Strong underlying components, low-complexity strategy. Suitable for conservative positions. |
| Middle Risk | 70 – 85 | One or more meaningful risk factors present. Acceptable with monitoring and position sizing. |
| High Risk | < 70 | Significant underlying weakness, aggressive strategy mechanics, or both. Requires active management and a clear risk tolerance. |
The Strategy Safety Score is a two-layer framework: the base score asks how safe are the building blocks, and the strategy adjustment asks how does the execution approach change that risk. Every additional protocol, every additional asset, and every additional layer of complexity is a potential weak point — the score is designed to make that visible in a single number.
Scores are reviewed and updated as protocol ratings change and as new research on strategy-specific risk mechanics becomes available.
For informational purposes only. Not financial or investment advice. DeFi strategies carry significant risks including total loss of capital. Always conduct your own research.
The Strategy Safety Score is DeFi Sentinel's framework for rating DeFi yield strategies. It combines a Base Safety Score — the average of the weakest-link protocol score and the weakest-link asset score in the strategy — with a Strategy Adjustment multiplier that captures execution risk. The final number maps to Low, Middle, or High risk bands.
The formula is Final Score = round(BaseScore × TotalMultiplier), where BaseScore = (MinProtocolScore + MinAssetScore) / 2 and TotalMultiplier is the product of strategy-specific modifiers covering leverage, looping depth, oracle dependence, bridge usage, and active management requirements. Scores above 75 are Low risk, 50-75 Middle, below 50 High risk.
A strategy is a chain — it breaks at its weakest link. Averaging hides single-point failures behind strong components; multiplying all scores unfairly penalises multi-protocol strategies built from best-in-class building blocks. The weakest-link approach reflects how real risk events propagate: an Aave + Pendle + ENA strategy fails at ENA first, not at the average of the three.
The multiplier captures risks that protocol and asset scores cannot see in isolation: leverage and looping depth, oracle dependencies, cross-protocol composability, bridge usage, manual rebalancing requirements, and time-decaying positions like PT/YT tokens. Each modifier sits between 0 and 1 and stacks multiplicatively, so risky execution can sharply discount a strategy built from individually safe components.
The Protocol Rating measures the safety of a single protocol in isolation. The Strategy Safety Score measures the safety of a position that combines protocols, assets, and a specific execution approach. Two users using the same AAA protocol can land on very different strategy scores if one of them is looping 5x and the other is depositing 1x and walking away.

Specializing in DeFi security audits and risk assessment with 5+ years of experience.


